The Financial Impact of Education during the 2008-2010 Crisis: A Data-Driven Exploration
By Joseph (Hyunwoo) Park
Data Link:
Bank Marketing Dataset (2008-2010)
The dataset contains demographic and financial data from over 45,000 bank customers targeted by a marketing campaign between 2008 and 2010, a period marked by the global financial crisis. It includes crucial features like age, education level, job type, marital status, and average yearly balance, shedding light on how economic conditions affected financial behavior across different educational backgrounds.
Central Interactive Visualization:
The core of this article is an interactive scatter plot that illustrates the relationship between age and average yearly balance across various education levels (primary, secondary, and tertiary). Users can filter the data by selecting an education level from the legend, which helps explore how financial behavior differs across these groups.
Additionally, users can select a range on the scatter plot by dragging the mouse. As the selection changes, the bar chart below will update to show the count of records for each education level within the selected range.
This interactive feature allows users to explore financial behavior patterns while highlighting how education shapes financial resilience during economic downturns.
Contextual Visualizations:
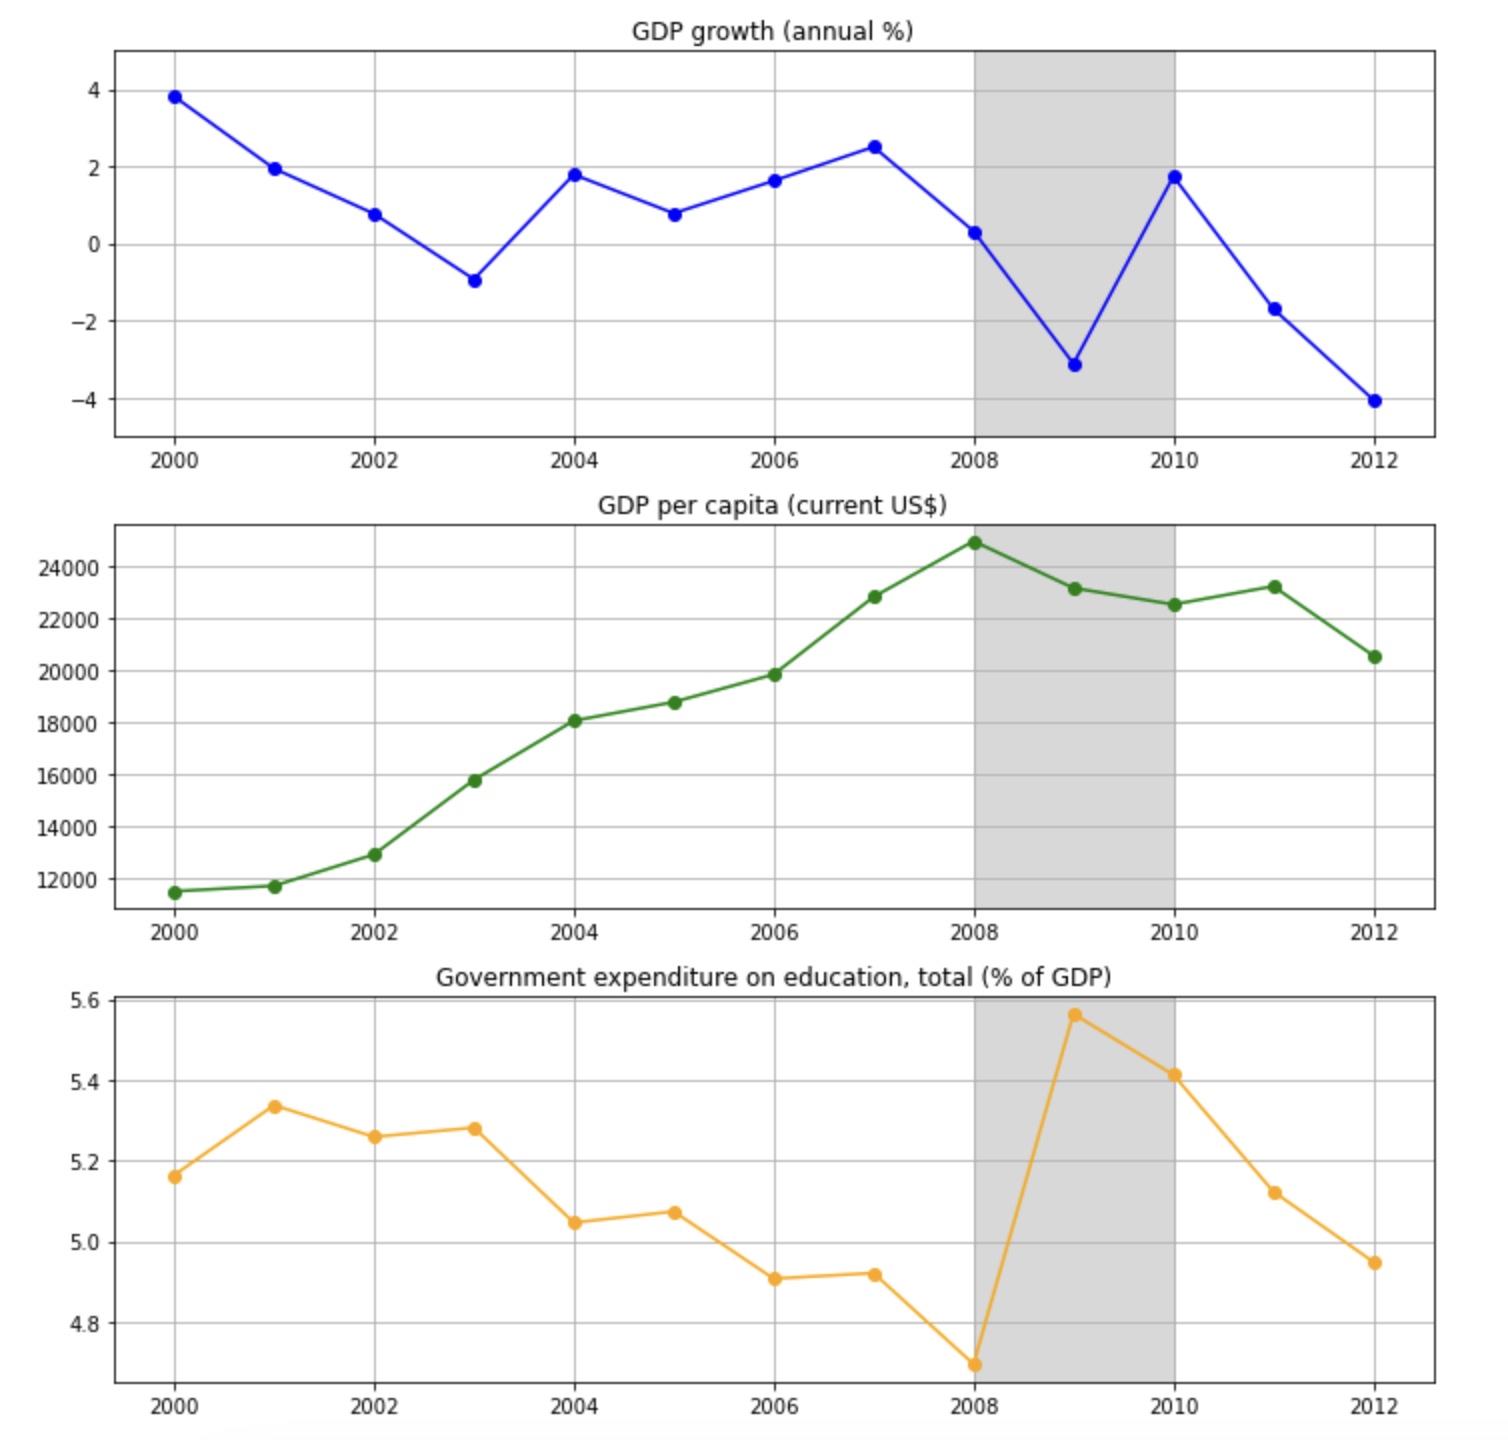
1. GDP Growth and Education Expenditure (2008-2010):
This visualization ties the fluctuations in GDP growth and education spending to financial behavior during the 2008-2010 period.
- The GDP Growth line (blue) shows the sharp economic dip during the financial crisis, reflecting the financial struggles faced by individuals, particularly those with lower education levels.
- The Education Expenditure line (yellow) highlights changes in government funding for education, a crucial factor in understanding long-term financial security for those in educational systems during the crisis.
These trends suggest that the economic instability caused by the crisis disproportionately impacted individuals with lower educational attainment.
2. Financial Behavior by Education Level (2008-2010):
This visualization further examines financial behavior across education levels. It reveals how education influenced financial security during the crisis:
- Tertiary-educated individuals tended to maintain higher balances, likely due to more stable income sources and job security.
- Primary-educated individuals had lower and more scattered balances, demonstrating increased vulnerability to financial instability.
This graph emphasizes that education served as a protective factor against financial hardship during the 2008-2010 crisis.
3. GDP per Capita (2008-2010):
This final visualization shows how the global recession impacted GDP per capita and highlights how macroeconomic changes affected financial behavior. The drop in GDP per capita directly correlates with increased financial hardship, especially among individuals with lower educational backgrounds.
This plot strengthens the findings from the previous visualizations by showing how economic factors like GDP and education expenditure shaped financial outcomes for individuals in the dataset.
Write-Up:
Understanding the Dataset (2008-2010):
The Bank Marketing Dataset provides valuable insights into the financial behavior of individuals during the 2008-2010 period, a time defined by the global financial crisis. The dataset includes 45,211 individuals and contains both numerical (e.g., age, average yearly balance) and categorical data (e.g., education level, job type).
The educational background of an individual serves as a key indicator of their financial resilience, especially in times of economic uncertainty.
Exploring the Interactive Visualization (2008-2010 Context):
The central scatter plot in the interactive dashboard allows users to explore how age correlates with average yearly balance, segmented by education level. Key insights include:
- Tertiary-educated individuals generally have higher balances, suggesting more stable financial conditions during the crisis.
- Primary-educated individuals exhibit lower balances, indicating greater vulnerability to financial strain.
These findings align with broader societal trends, where higher education often correlates with better financial security, particularly during economic instability.
Connecting the Data to Public Understanding:
The contextual visualizations provide further insights into the connection between education and financial stability:
- GDP Growth and Education Expenditure: The decline in GDP during the financial crisis reflects the broader economic challenges faced by individuals, especially those with lower education levels.
- Financial Behavior by Education Level: The contrast between financial behaviors across education levels highlights education as a protective factor against financial instability.
- GDP per Capita: A decrease in GDP per capita correlates with greater financial difficulties for individuals with lower education, emphasizing the link between macroeconomic trends and personal financial outcomes.
These visualizations clarify how macroeconomic conditions and educational attainment are intertwined, with education playing a crucial role in shaping financial resilience during times of crisis.
Conclusion:
The combination of interactive visualizations and contextual charts allows for a deep exploration of how education and economic trends intersect to influence financial behavior. The 2008-2010 period, marked by the global financial crisis, shows that higher education helped individuals maintain better financial stability, while those with lower education levels were more vulnerable to financial hardships. By linking education expenditure, GDP growth, and financial outcomes, this article highlights how education is not only a personal asset but also a key factor in navigating economic downturns.
Sources for Contextual Visualizations:
- The Bank Marketing Dataset: “Bank Marketing Dataset.” UCI Machine Learning Repository. Available at UCI Dataset.
- The World Bank Data: “World Development Indicators.” The World Bank. Available at World Bank Data.